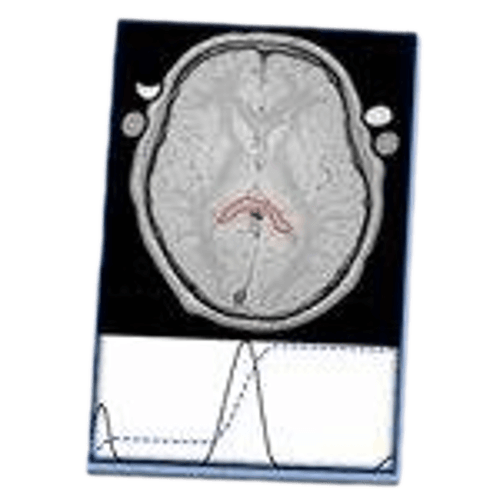
AnalyzeNNLS creates a T2 distribution from the averaged decay data.
Contributors
Thorarin A. Bjarnason1,2,3
Estimated cost
Free
Progress
Beta, v2.5.1, BSD license
Multi-exponential curve fitting for MRI
AnalyzeNNLS is a MatLab ROI-based analysis suite for multiecho MRI data. AnalyzeNNLS creates a T2 distribution from the averaged decay data. Regional fractions and geometric T2 times can be determined.
AnalyzeNNLS allows multi-exponential decay image analysis with a user-friendly graphical user interface. Analyzing the time evolution of MRI signals can bring valuable diagnostic information. This decay is often evaluated through the challenging task of fitting multi-exponential signals. This ill-posed problem can cast light on sub-voxel structure caused by water compartmentalization, with can be used as a quantitative MRI bio-marker for myelin, among others.
The program is vendor agnostic and platform independent. The fitting routines for AnalyzeNNLS have been implemented on MatLab. GUI code is separated from the main code which makes it easy for users to experiment with novel multi-exponential inversion algorithms.
Publications
Affiliations
1Diagnostic Imaging Services, Interior Health, Kelowna, Canada
2Department of Radiology, University of British Columbia, Vancouver, Canada
3Department of Physics, University of British Columbia Okanagan, Kelowna, Canada


